Analytics
Analytics has three pages, all built from the same figures: Overview, Deliverability and Engagement. Every member of the workspace can see them.
The time range
The picker at the top right of each page chooses Last 7 days, Last 30 days (the default) or Last 90 days. The range stays the same while you move between the three pages.
A range is made of whole UTC calendar days and always ends today: Last 7 days is today and the six days before it, starting at midnight UTC.
What the numbers mean
Every figure is about one group of emails: the emails sent during the range. Whatever happens to them later counts too, so a bounce that arrives tomorrow for an email sent today raises today's bounces, and each email counts at most once in each figure, however many events it has.
| Figure | Counts the emails sent in the range that... |
|---|---|
| Sent | Amazon SES accepted: every email except queued and failed ones. |
| Delivered | were sent and then delivered, opened, clicked or complained about. An open, a click or a complaint proves the email arrived even when the delivery report is late or missing. |
| Bounced | were sent and bounced. |
| Hard bounces | bounced permanently: Amazon SES reported the bounce as Permanent. |
| Soft bounces | bounced for any other reason Amazon SES reported, Transient or Undetermined. |
| Complained | were sent and reported as spam by their recipient. |
| Opened (unique opens) | were sent and opened at least once. |
| Clicked (unique clicks) | were sent and had at least one link clicked. |
| Failed | Amazon SES never accepted. |
The rates divide those counts:
| Rate | Formula | Shown with |
|---|---|---|
| Delivery rate | delivered / sent | one decimal |
| Bounce rate | bounced / sent | two decimals |
| Complaint rate | complained / delivered, since only a delivered email can be reported as spam | two decimals |
| Open rate | opened / delivered | one decimal |
| Click rate | clicked / delivered | one decimal |
A rate shows - instead of 0% when there is nothing to divide by, for example a click rate before anything was delivered.
These are your workspace's own figures, worked out from your emails. They are not the account-wide reputation metrics Amazon SES shows in its own console.
Overview
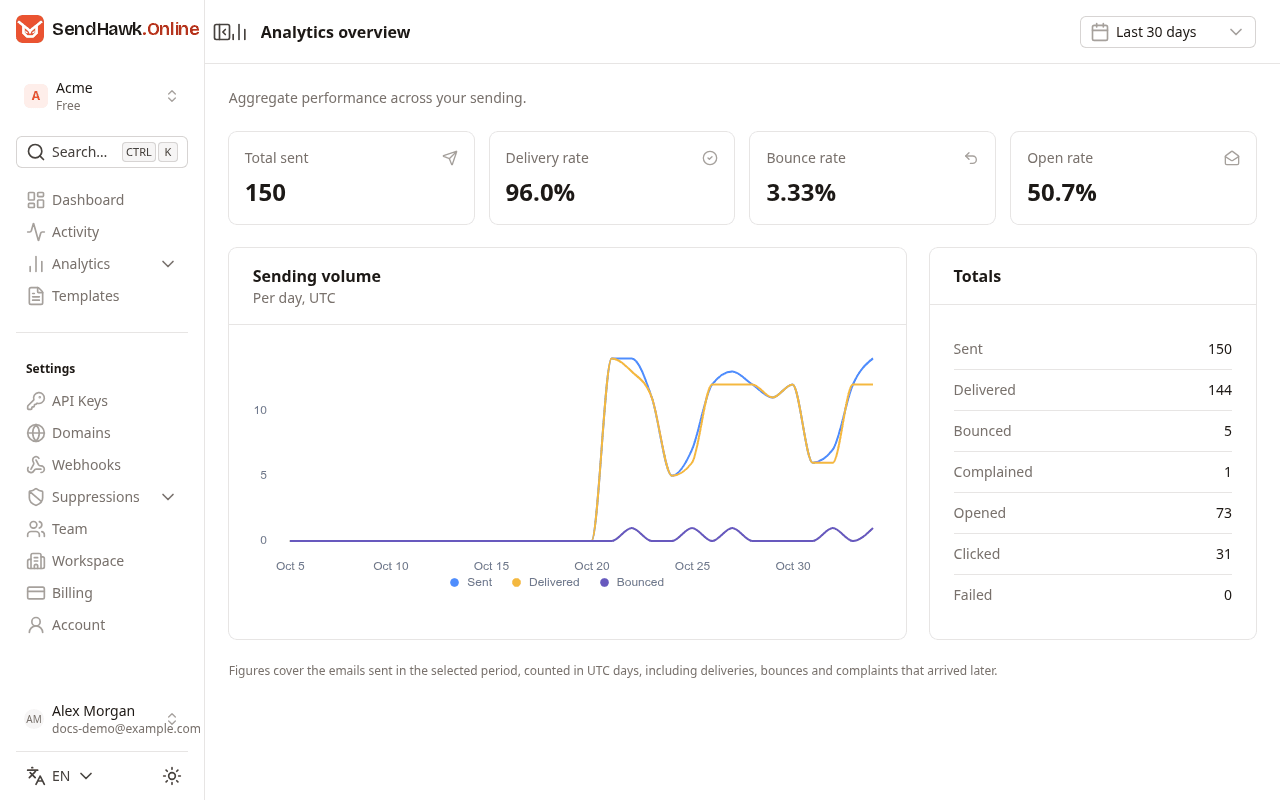
- The four cards: Total sent, Delivery rate, Bounce rate and Open rate.
- Sending volume: sent, delivered and bounced emails per UTC day. Hover over the chart to see a day's numbers.
- Totals: Sent, Delivered, Bounced, Complained, Opened, Clicked and Failed for the whole range.
When nothing was sent in the range, the page says so instead, with a link back to the dashboard. Pick a longer range, or send your first email.
Deliverability
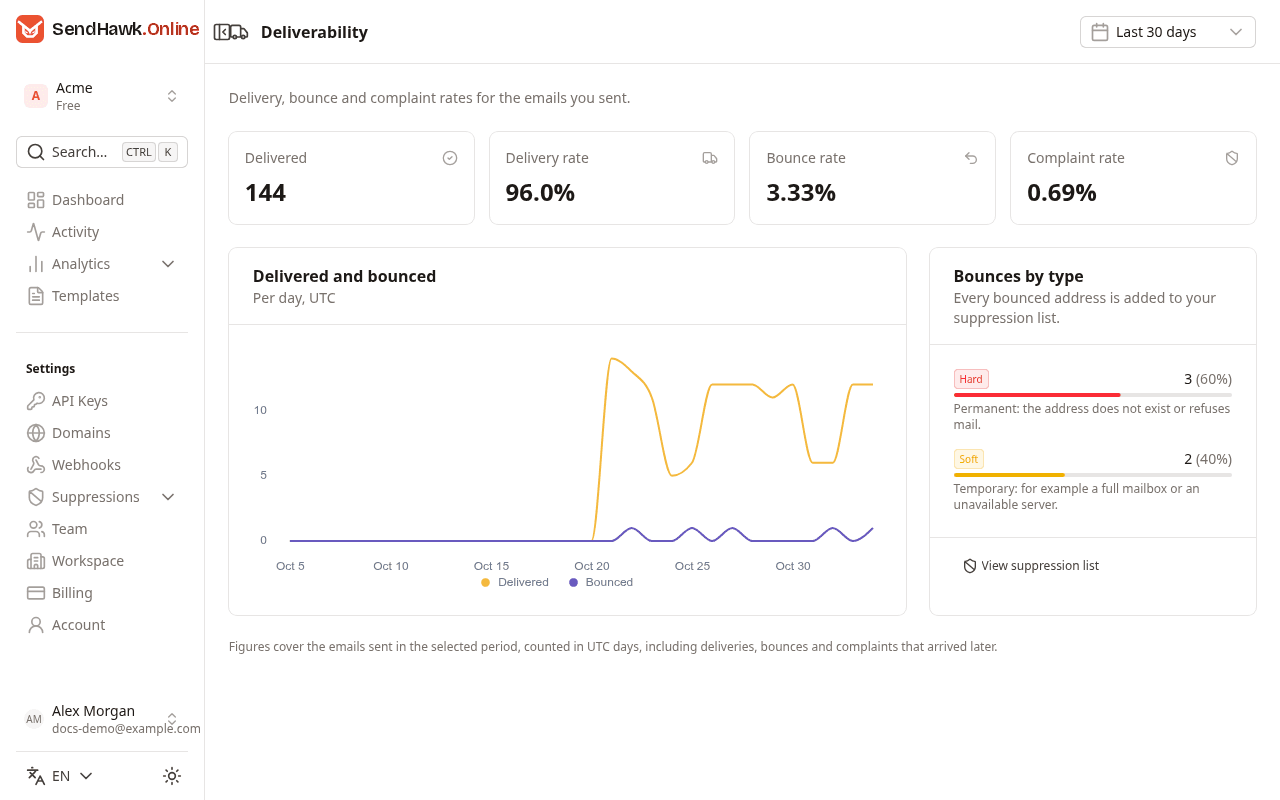
- The four cards: Delivered, Delivery rate, Bounce rate and Complaint rate.
- Delivered and bounced: both per UTC day.
- Bounces by type: hard and soft bounces, each with its count and its share of all bounces. A hard bounce means the address does not exist or refuses mail; a soft one is temporary, such as a full mailbox or a server that could not be reached. View suppression list opens Bounces: every bounced address is suppressed. With no bounce in the range, the card says so.
Mailbox providers judge you by bounces and complaints. Keep the bounce rate low by removing addresses that bounce from your own lists, and treat every complaint as a reason to look at what you send and to whom.
Engagement
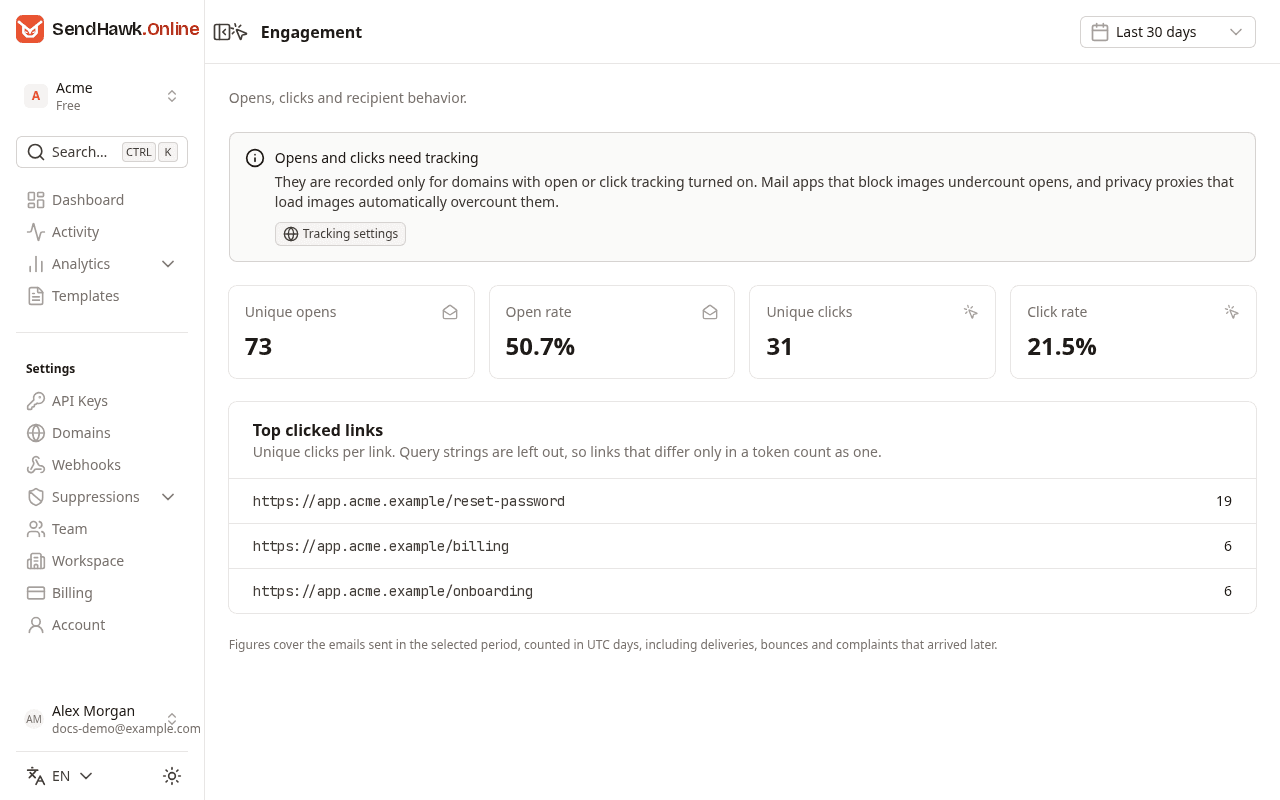
- Opens and clicks need tracking: they are only recorded for emails sent from a domain with open or click tracking on. Tracking settings opens Domains.
- The four cards: Unique opens, Open rate, Unique clicks and Click rate.
- Top clicked links: up to ten links, most clicked first, each with its unique clicks, the number of emails in which it was clicked at least once. The query string and anything after
#are cut off, sohttps://app.example.com/reset?token=abcand?token=xyzcount as one link, and no token ever shows up here.
On the dashboard and the billing page
The dashboard shows the same figures for the last 7 days, and Sent this month counts the emails sent in the current UTC calendar month, whatever range you picked here. That monthly number is also the usage meter on Billing.